
When working in academia, it is easy to forget how rare it is to have a PhD. However, data show that only a very small percentage of people hold a PhD degree. Learn more about the percentages of PhD holders, in addition to the numbers of PhD graduates and new PhD students in selected OECD countries.
Contents
Percentages of doctoral degree holders
While it is widely known that only a small percentage of people are PhD holders, actual data is not always easy to come by. The OECD (Organisation for Economic Co-operation and Development) is one of the few organizations that systematically surveys the state of education in its thirty-eight member countries.
According to the OECD’s Education at a Glance 2022 report, 1.3% of adults (25-64 year-olds) held a PhD in 2021 across the thirty-eight OECD countries.
There are of course country-specific differences. In Denmark and Germany, for instance, roughly 1% of the total population held a PhD in 2021. In the US and the UK, approximately 2% of the total population held a PhD in 2021. And in Slovenia, it was 5% of the population in 2021!
The following chart provides an overview of percentages of adults, defined as those between 25 and 64 years of age, who held a doctoral degree in 2021 in selected OECD countries:
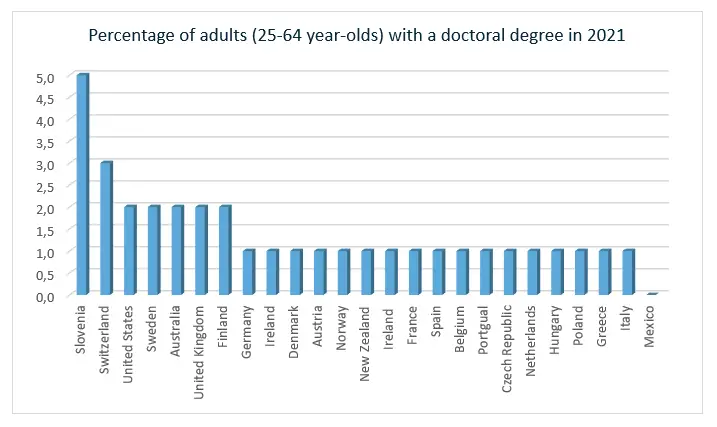
Data retrieved from OECD Education at a Glance 2022, p. 45.
In the Education at a Glance 2022 report, the percentages of people who obtained a doctoral degree in 2021 are rounded up. In reality, more subtle differences exist between countries. More detailed data are available on the percentage of adults (25-64 year-olds) with a doctoral degree in 2017. While this data is older, it paints a more varied picture of the differences between countries:
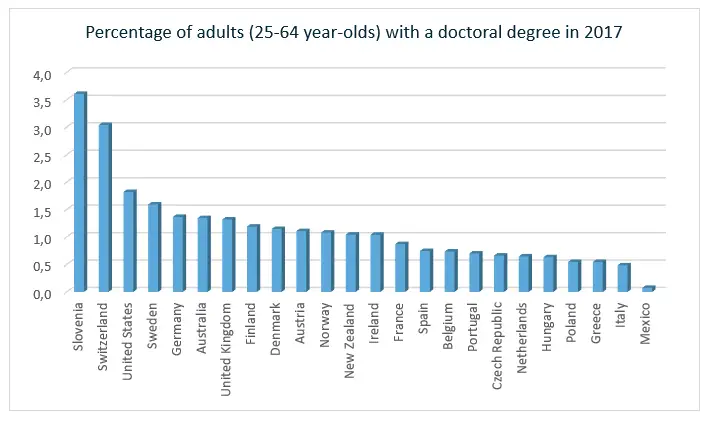
Data retrieved from https://www.oecd.org/innovation/inno/careers-of-doctorate-holders.htm
Combined, these insights make one thing very clear: Graduating with a doctoral degree is something special! Once you accomplish the goal of getting a PhD, you will belong to a small percentage of people who obtained the highest academic degree.
Numbers of PhD graduates
Every year, new people graduate with a PhD degree. Unfortunately, the OECD only records data from PhD graduates who are younger than 35 years. Personally, I find this choice surprising as doing a PhD later in life has many advantages. I would assume that there is a high number of PhD graduates every year who are older than 35.
Even though the available data does not provide a full picture of the situation, it generates some interesting insights. For instance, the average number of PhD graduates (<35 years of age) across OECD countries decreased since 2015:
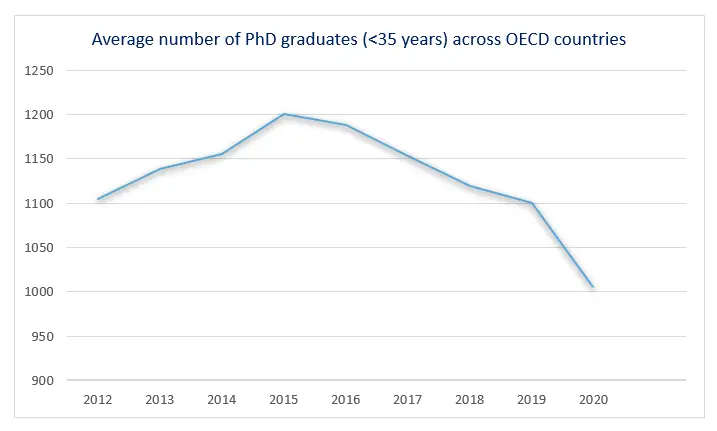
Data retrieved from OECD.Stat ‘Graduation rates and entry rates’.
The actual numbers of PhD graduates differ quite considerably when exploring individual countries. The following graph shows the total number of PhD graduates of eight OECD countries, as well as the division between female and male graduates in 2020:
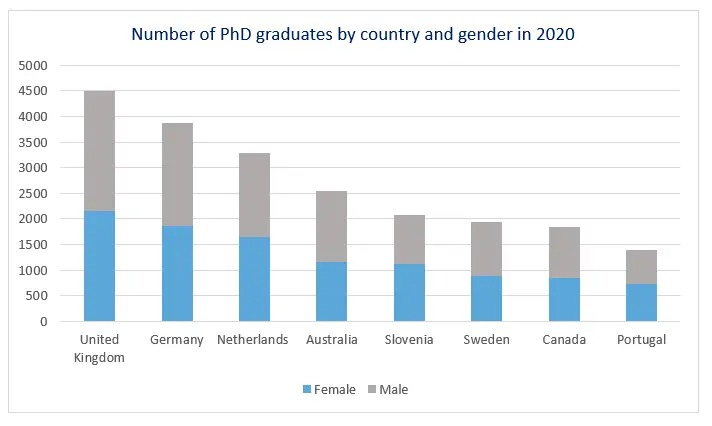
Data retrieved from OECD.Stat ‘Graduation rates and entry rates’.
In the UK, for instance, 2163 female individuals graduated with a PhD degree in 2020, compared to 2335 male individuals. Canada, on the other hand, gained 838 female and 1003 male new PhD holders in 2020. Unfortunately, data on gender distributions of PhD graduates was not available for the US.
The fields in which people obtain their PhD degree provides another interesting perspective. The OECD differentiates between academic fields, several of which can be found in the first column of the following table. This table showcases the number of PhD graduates in 2020 by academic field in selected countries:
| Australia | Canada | Germany | Netherlands | Sweden | United Kingdom | United States | |
| Education | 441 | 327 | 381 | 42 | 99 | 1040 | 12180 |
| Arts and humanities | 851 | 687 | 1782 | 348 | 134 | 3798 | 6635 |
| Social sciences, journalism and information | 870 | 1347 | 1470 | 413 | 184 | 4207 | 9654 |
| Business, administration and law | 694 | 336 | 2343 | 372 | 94 | 1807 | 4049 |
| Natural sciences, mathematics and statistics | 1975 | 2169 | 7583 | 822 | 593 | 7613 | 17022 |
| Information and communication technologies | 398 | 300 | 858 | 84 | 115 | 1128 | 2396 |
| Engineering, manufacturing and construction | 1682 | 1581 | 3381 | 543 | 815 | 4130 | 11494 |
| Agriculture, forestry, fisheries and veterinary | 347 | 192 | 800 | 315 | 53 | 234 | 1135 |
| Health and welfare | 1588 | 738 | 7492 | 1516 | 900 | 4421 | 8566 |
Number of PhD graduates in 2020 by selected fields.
Data retrieved from OECD.Stat ‘Graduates by field’
In the seven selected OECD countries, the field of natural sciences, mathematics and statistics produced by far the highest number of PhD graduates in 2020.
Data on new PhD students
Every year, new individuals enroll in doctoral degree studies. According to the OECD’s Education at a Glance 2022 report, the total number of new PhD students across the OECD decreased by 4% between 2013 and 2020. However, the report also stipulates that this average decrease is heavily influenced by a large drop in new PhD students in Poland (-77%) and in the Slovak Republic (-26%).
The following table shows the number of new PhD students in selected countries according to academic fields:
| Australia | Canada | Germany | Netherlands | Sweden | United Kingdom | United States | |
| Education | 537 | * | 677 | 26 | 72 | 1430 | * |
| Arts and humanities | 1355 | * | 2971 | 131 | 123 | 4662 | * |
| Social sciences, journalism and information | 1021 | * | 1978 | 237 | 206 | 5090 | * |
| Business, administration and law | 752 | * | 3152 | 141 | 68 | 2656 | * |
| Natural sciences, mathematics and statistics | 2038 | * | 8657 | 522 | 493 | 8438 | * |
| Information and communication technologies | 481 | * | 1419 | 46 | 165 | 1655 | * |
| Engineering, manufacturing and construction | 1593 | * | 5019 | 258 | 604 | 4521 | * |
| Agriculture, forestry, fisheries and veterinary | 308 | * | 769 | 25 | 58 | 337 | * |
| Health and welfare | 1800 | * | 7475 | 532 | 981 | 4393 | * |
Number of new entrants to doctoral studies selected fields.
Data retrieved from OECD.Stat ‘New entrants by field’
(*no data available)
The average percentage of female entrants to doctoral programmes across all OECD countries is 49% (Source: Education at a Glance 2022). The following graph shows the share of new female entrants to doctoral programmes in 2020 in several countries:
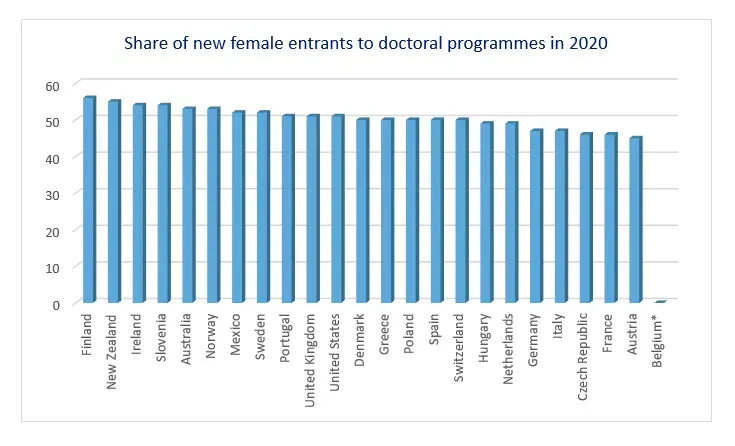
Data retrieved from OECD Education at a Glance 2022.
(*no data available)
Across OECD countries, the median age of people starting with a doctoral degree is 29 years (Source: Education at a Glance 2022).